FSAE Cooling Testing and Pump Selection
For the 2023-24 academic year, I led the electric drivetrain cooling management and optimization for the Cal Poly Racing CP24E vehicle. I analyzed the cooling requirements of drivetrain components, constructed a system curve for the previous year's cooling loop, and sourced a new pump that best fit the updated system design while reducing weight by 35%. I also developed a testing plan to measure the head loss within the cooling loop and applied system curve "k" constants to account for the head loss contributions of individual components, enabling precise adjustments to the overall system curve.
Final System Curve
I began this process by evaluating the cooling requirements for the critical components of the electric drivetrain (the motor and the motor controller):
These requirements showed that the minimum flow rate of coolant (water) in our system was 8L/min. The pump that had been used in the vehicle was very oversized (both in terms of flow rate and size) and several years old. Both of these aspects led us to believe that a new pump could both optimize the system and improve our confidence in its reliability.
I wrote a testing plan that would use 5 gallon buckets to run water through the CP23E vehicle's cooling loop with varying heads to then measure flow rate at each point. 5 trials were conducted at each head to calculate an average flow rate for each scenario and build the system curve.
I wrote a testing plan that would use 5 gallon buckets to run water through the CP23E vehicle's cooling loop with varying heads to then measure flow rate at each point. 5 trials were conducted at each head to calculate an average flow rate for each scenario and build the system curve.
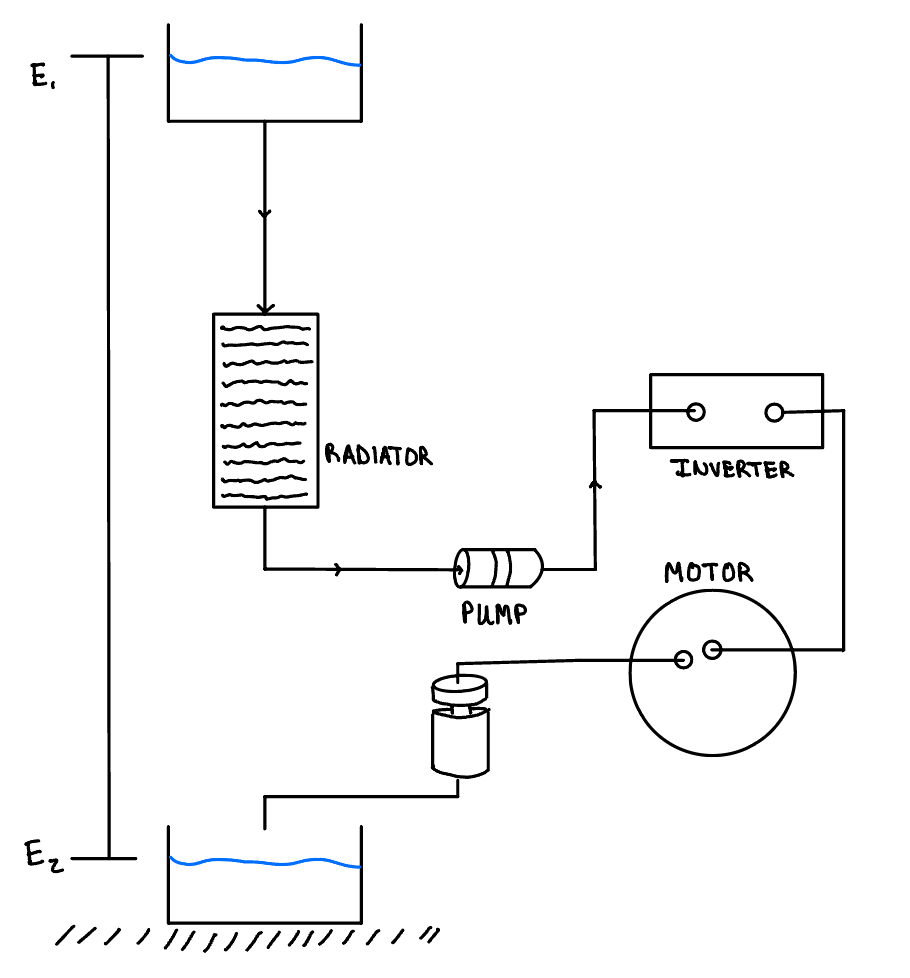
Test Plan Schematic
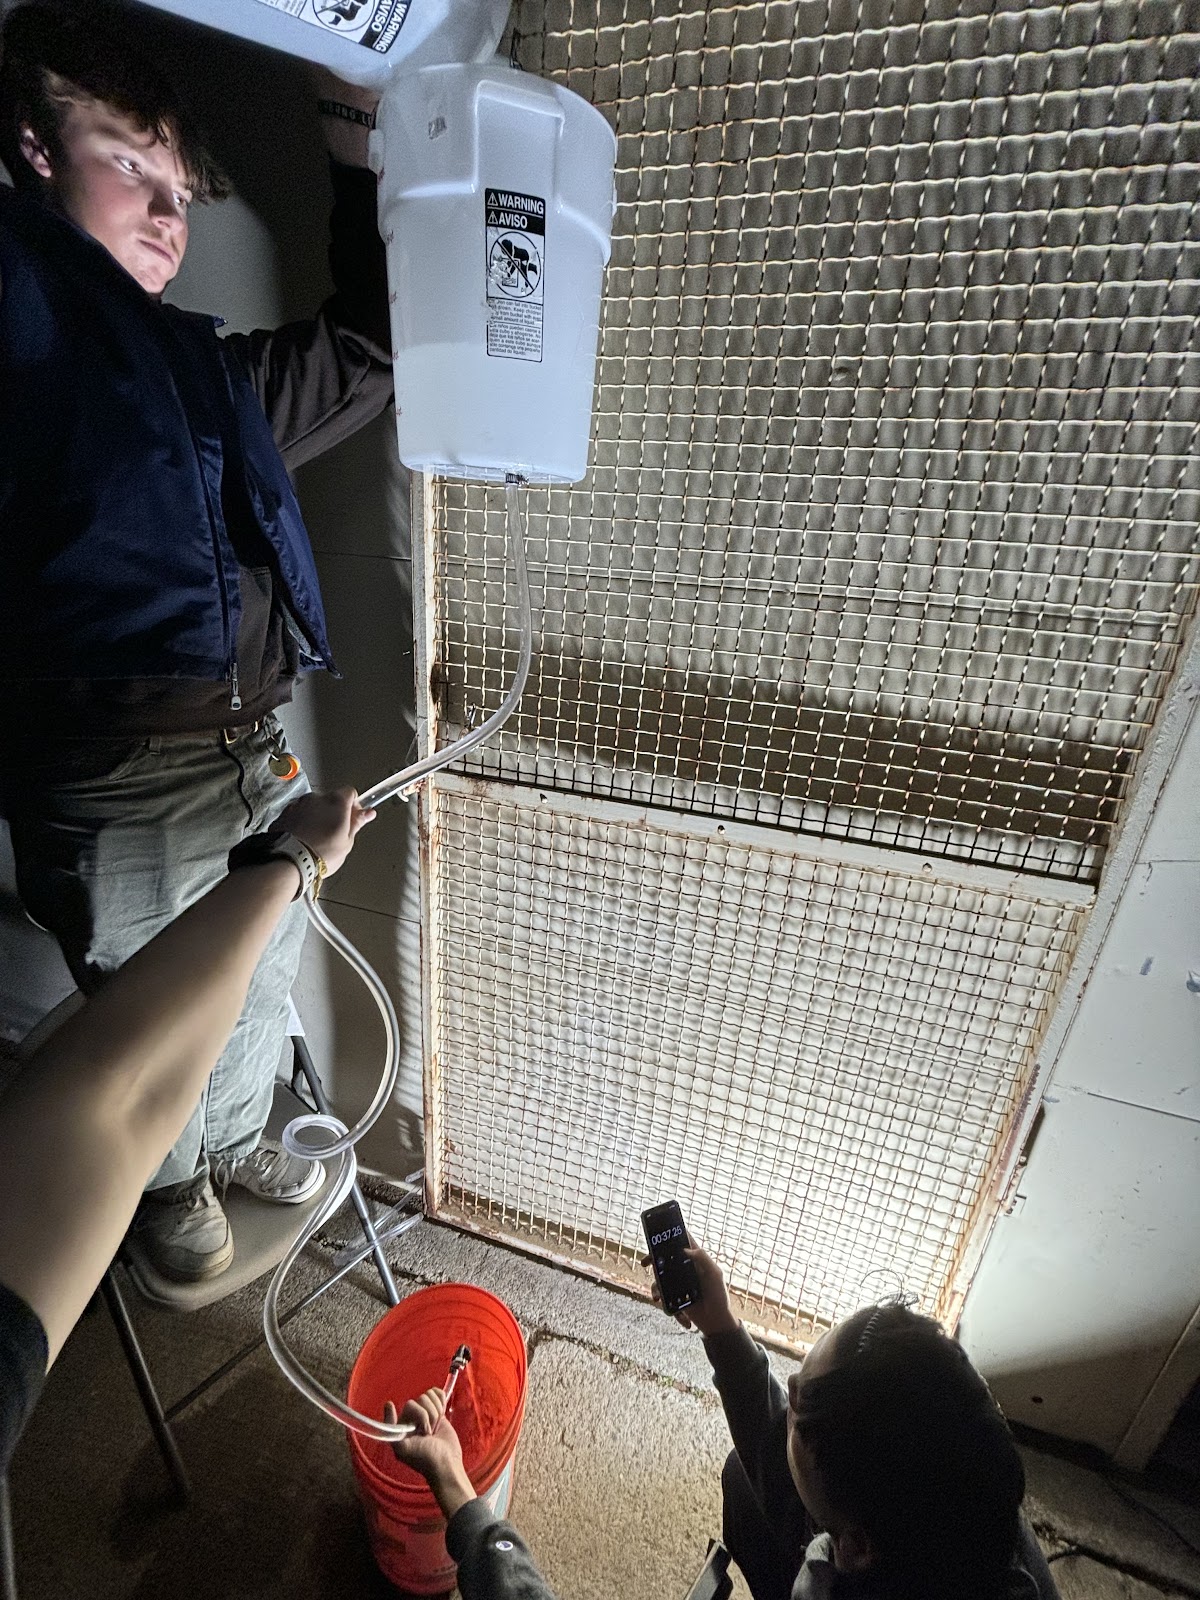
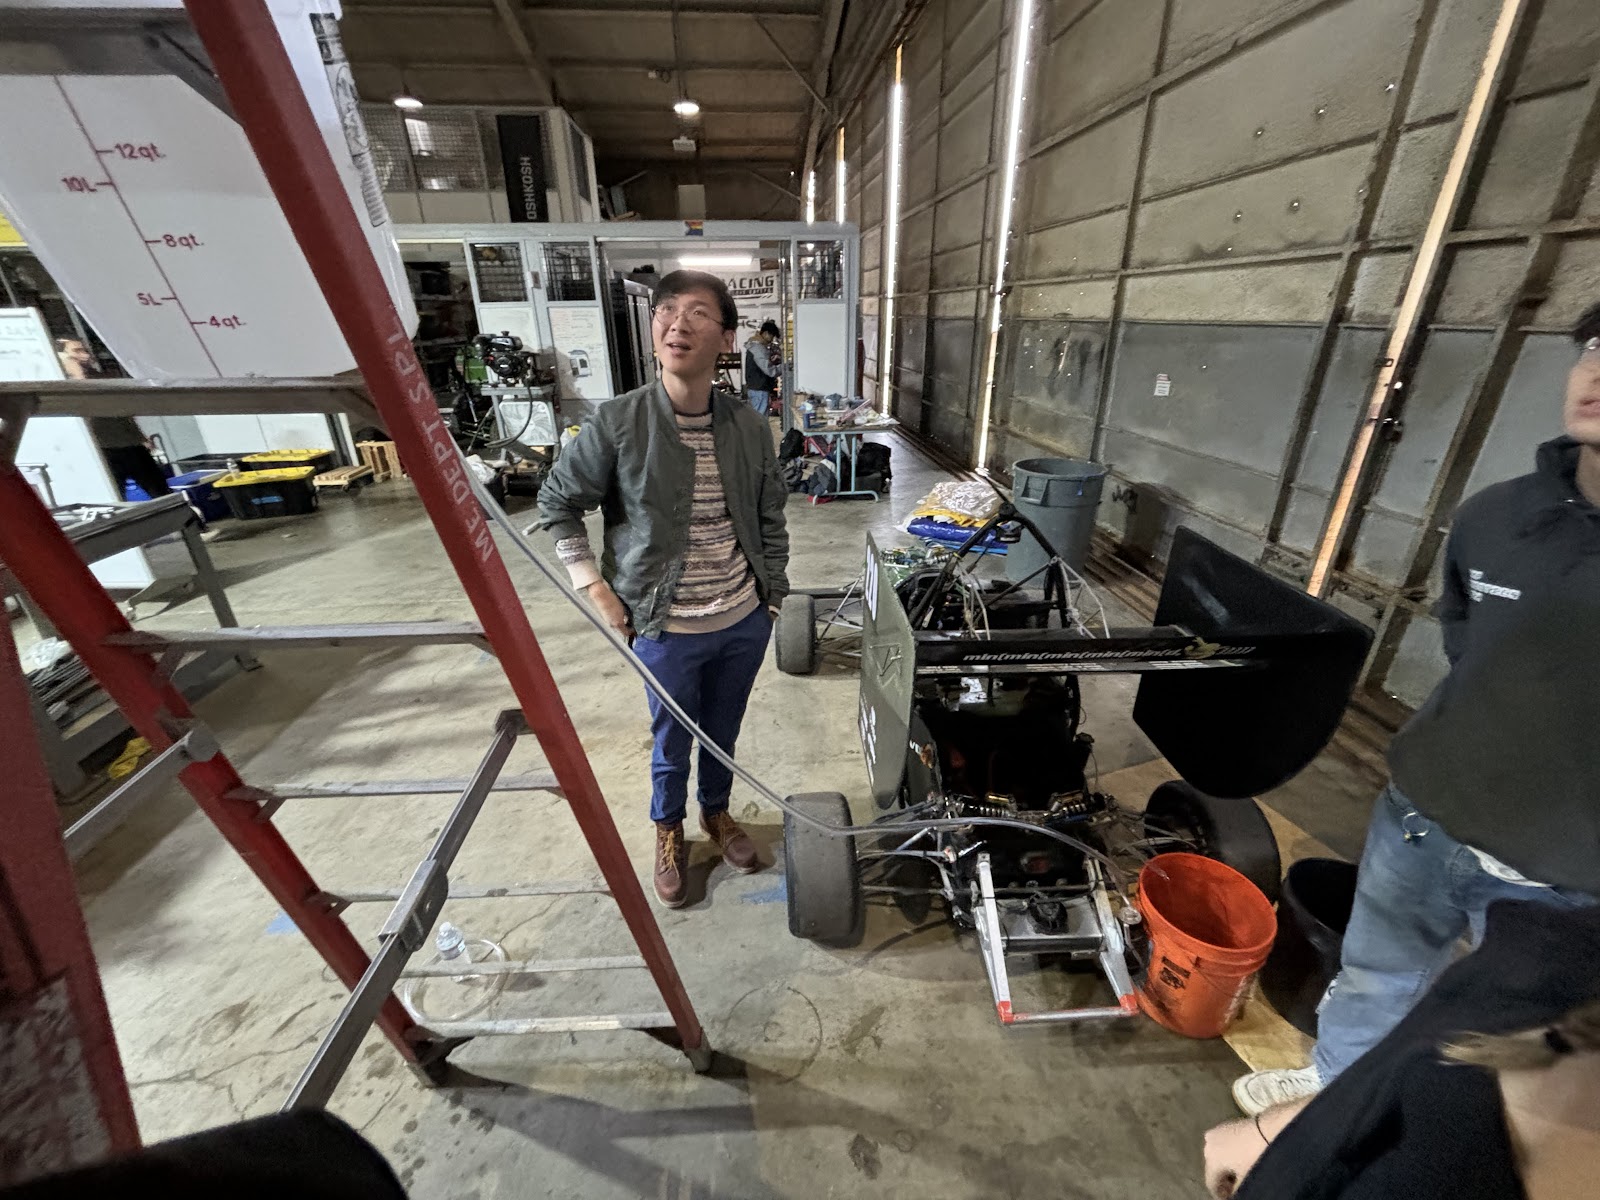
Photos of Testing
Since we used a "runner" which was not part of the actual cooling loop to raise the water to different heights, we redid the test using only the bucket and runner to find how much additional resistance was being added to our test data. We subtracted the k-constant of the system curve of just the "Bucket and Runner" from the k-constant curve of the "System + Bucket and Runner" curve. This left us with a curve that accurately represented the resistance of the CP23E cooling loop.
I used this data to explore several pump options, taking into account size, mass, and cost. I ended up in contact with Davies Craig who offered us a range of pumps to us at a discount.
I used this data to explore several pump options, taking into account size, mass, and cost. I ended up in contact with Davies Craig who offered us a range of pumps to us at a discount.
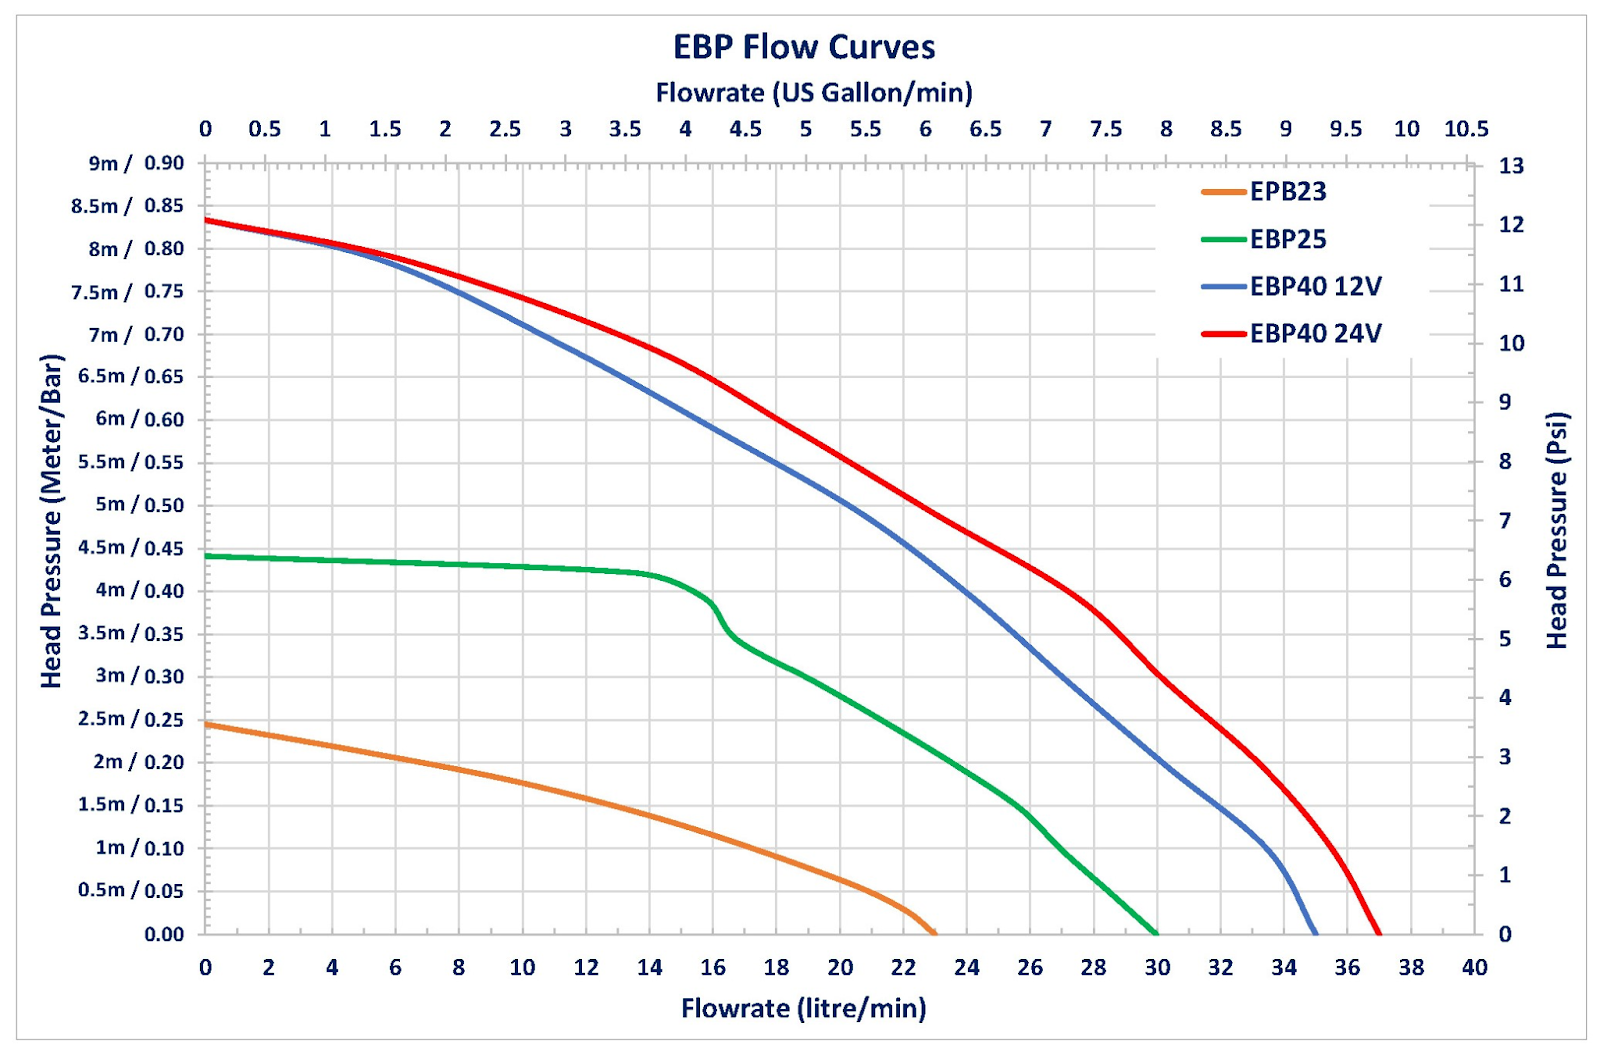
Davies Craig Pump Curves
Mass difference between pump models

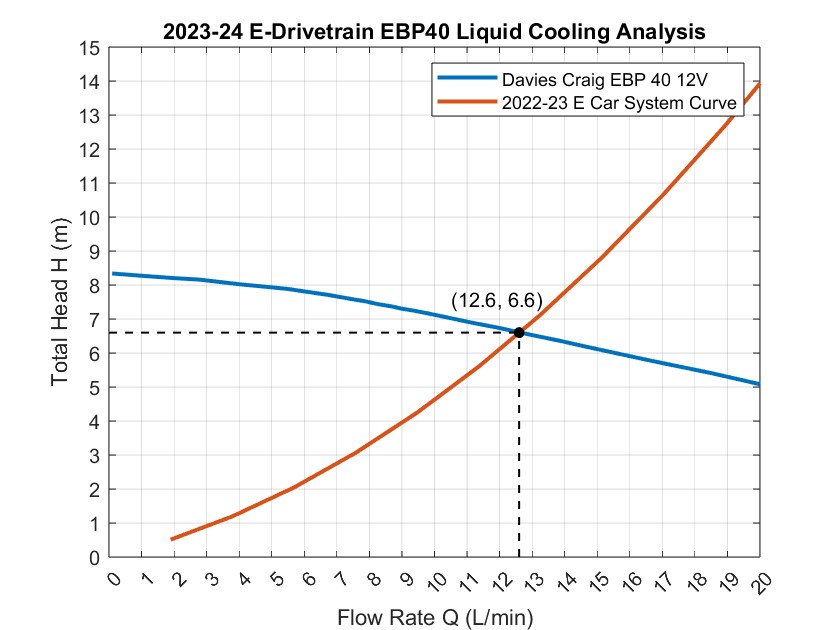
After overlaying these pump curves with our system curve, I found the operating point for each of the models. I determined the Davies Craig EBP40 12V was the most optimal choice for our cooling requirements as it was 35% lighter than the previous pump while providing 12.6 L/min of flow rate which exceeded our minimum requirement.

EBP 40 Operating Point
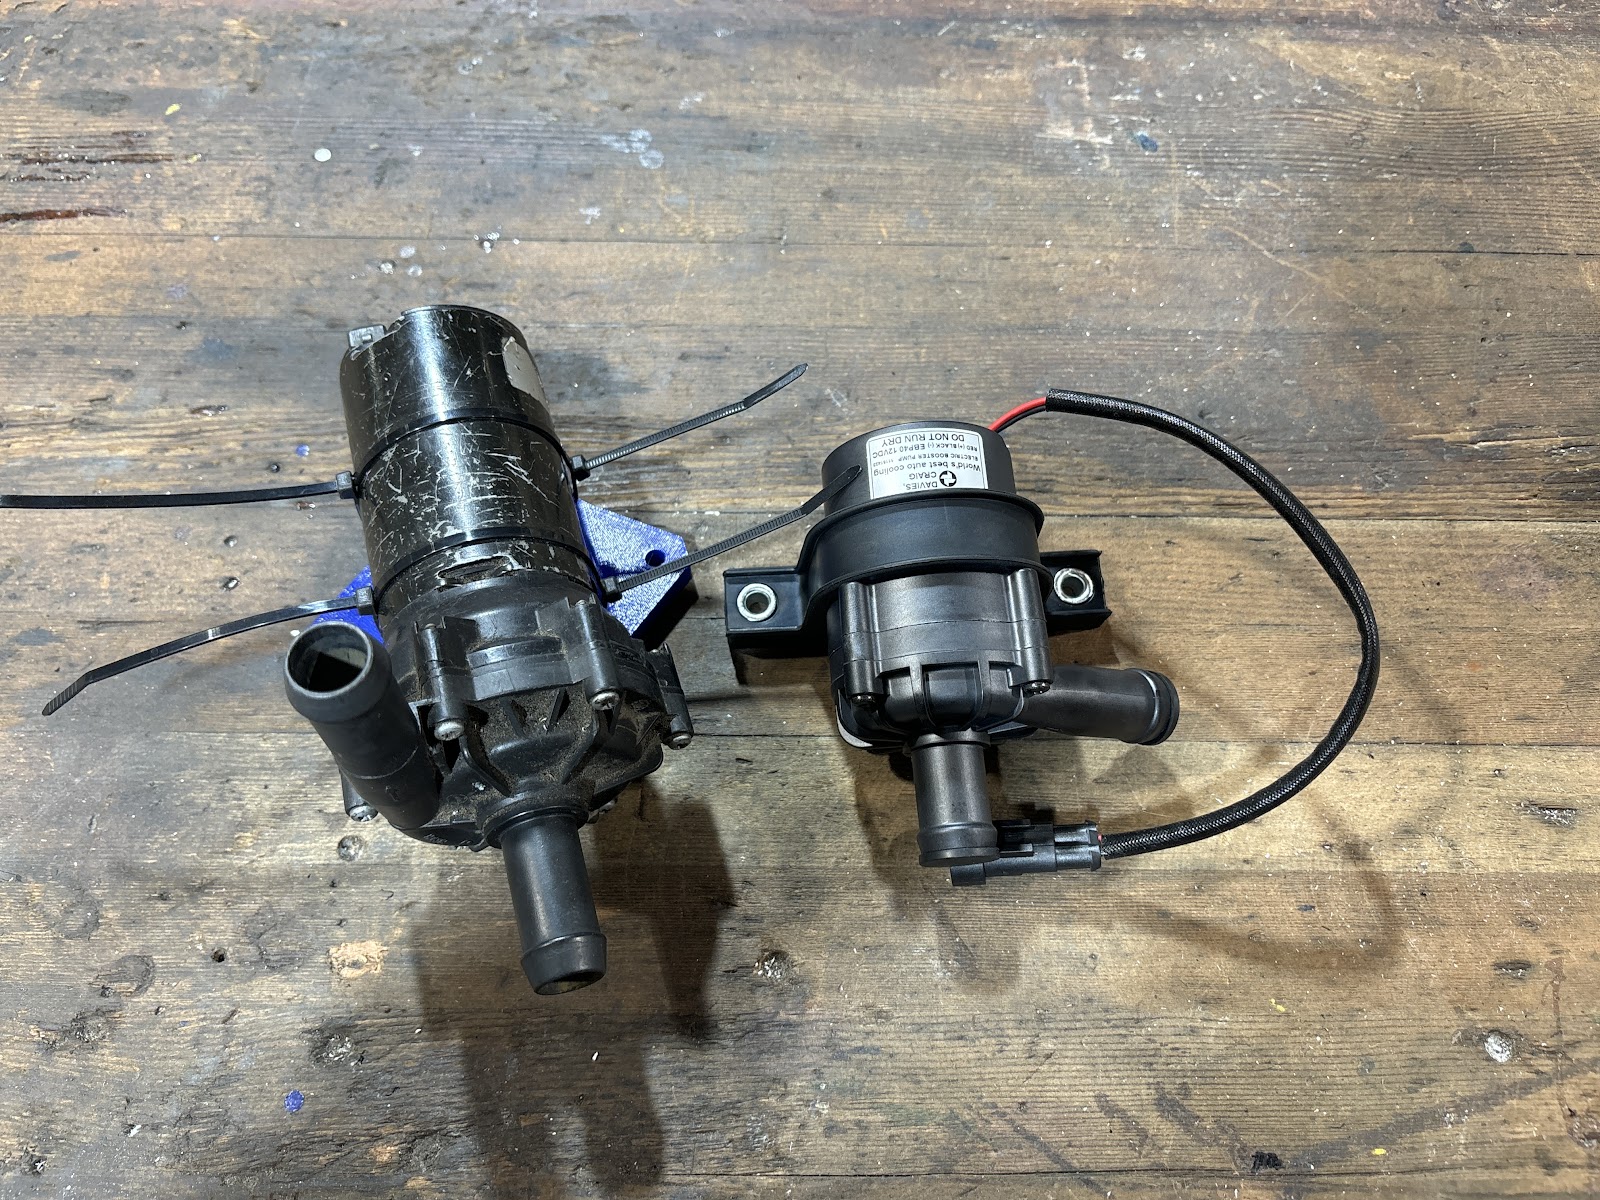
Previous Pump (Left) Compared to EBP40 (Right)
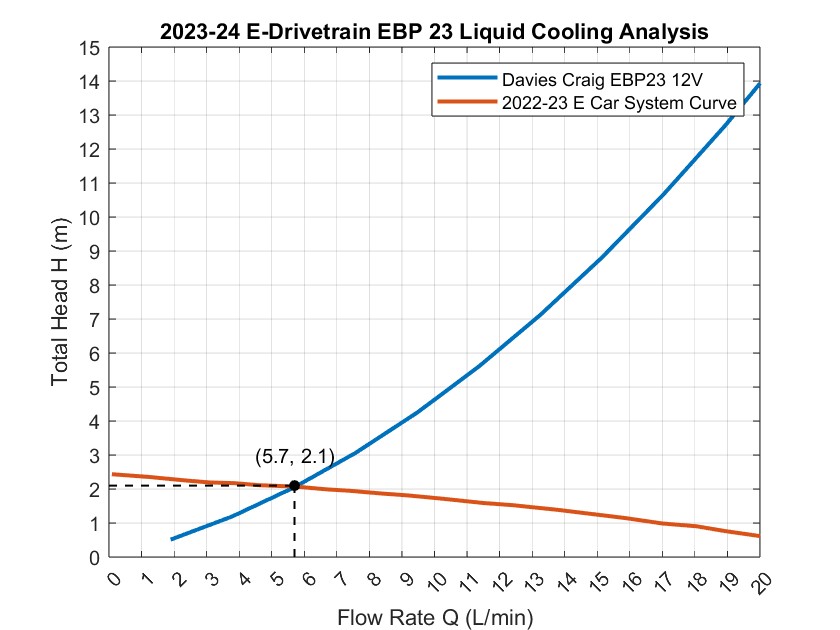
Operating Point of EBP 23 Which Did Not Meet Requirements
The EBP 40 pump was used in the CP24E vehicle and achieved the cooling performance expected from it. MOTEC data showed that both the Motor Controller and Motor stayed well below their max temperature requirements, seeing a high of only 58 degrees Celsius.

MOTEC Data From Endurance Testing. Orange Line = Motor Temperature. Purple & Blue = Motor Controller Temperature.

CP24E Cooling Order
This project demonstrated the importance of precision in cooling system optimization for high-performance applications. By accurately assessing requirements, refining system curves, and selecting an efficient pump, we achieved a lighter and more reliable system while maintaining optimal performance.

Comments
Post a Comment